

Employees Report Not Working Effectively on 1 in 5 Working Days

Employees report not working effectively on about 1 working day in 5.
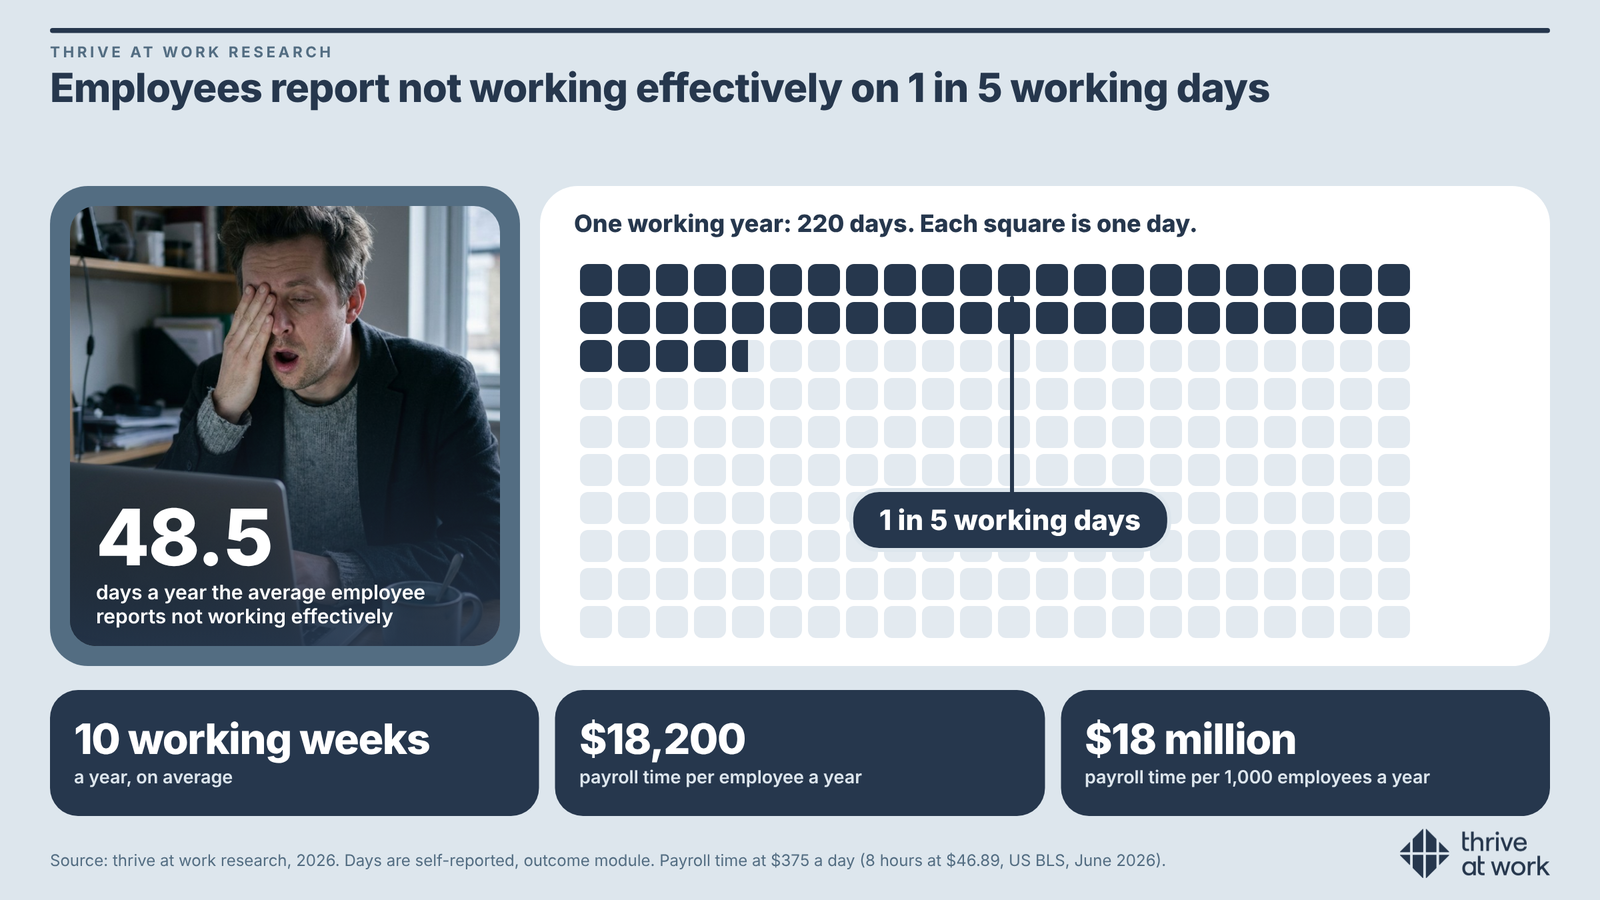
Days a year the average employee reports not working effectively, shown against a 220-day working year. Source: thrive at work research, 2026.

Payroll time per employee a year for days not working effectively, at $375 a day. Source: thrive at work research, 2026.
The least-capacity quarter reports 71 more such days a year than the most-capacity quarter, about $26,600 of payroll time per employee, new research finds
Being at work but not working effectively is known as presenteeism. Capacity is the energy, recovery, focus and resilience a person has to keep performing, and it is the reading that tracks these days.
The numbers that matter:
• $375 a day. An hour of labor costs $46.89 on average for US private employers, wages and benefits combined (US Bureau of Labor Statistics, June 2026), so an 8-hour working day costs about $375.
• 71 days, about $26,600. The gap between the lowest and highest quarter on capacity is 71 days a year, about a third of a working year, or about $26,600 of payroll time per employee. Under more conservative ways of converting the answers the gap is 52 to 65 days, about $19,500 to $24,400.
• About $18 million per 1,000 employees. The 48.5-day average across 1,000 employees is 48,500 days, about $18.2 million of payroll time. It is the value of the time, not a measured loss: a day of working ineffectively is not a day of no output.
• 54, 54 and 49 days. That is the difference in days between the least and most favorable answers on workload sustainability, manager support and sleep duration: nearly 11, 11 and 10 working weeks, or about $20,300, $20,300 and $18,400 of payroll time.
• 24 days. Retail employees report the most days a year of not working effectively, 66, which is 24 more than transport and logistics (42): nearly 5 working weeks, about $8,900 of payroll time.
Not a rounding error
In the lowest capacity quarter the days equal 39% of a 220-day working year. In the highest quarter they equal 6%. The pattern does not hinge on one convenient calculation: with the three most similar items removed from the capacity score the gap is still 70 days.
A measured difference, not a promise
Ten percent more capacity goes with about 19 fewer days a person, which is about $7,100 of payroll time. Closing half the distance from the sample average to the top quarter on capacity goes with about 16 fewer days, about 3 working weeks and $6,000 a person. These are differences between groups, not a projected return. The World Health Organization and the International Labour Organization describe work-related psychosocial risk as a major occupational health burden.
Two sides of the same employee
Engagement shows whether people want to perform and whether work lets them: enablement, leadership, growth and connection. Capacity shows whether they have the energy, recovery, focus and resilience to keep performing. Both are measured because they explain different parts of the same days. Engagement alone accounts for about a sixth of the differences between employees in days not working effectively. Adding capacity lifts that to more than 4 in 10 (17% to 43%). With engagement held equal, each point of capacity goes with 1.9 fewer days a year, about 3 times as many as a point of engagement. Capacity is designed as a workforce performance measure, read alongside engagement.
“An employer pays for every working day, including the days when people cannot work effectively,” said Jerry Fišer, Founder of thrive at work. “An engagement survey does not show how many of those days there are. Capacity does.”
Read the full Scientific Foundations White Paper: https://www.thriveatwork.ai/research/scientific-foundations
About the research
The findings are part of a research program covering 7,031 employees and 216,301 responses across Europe and North America; the days not working effectively came from part of the sample, who were asked on how many days in the past month exhaustion or stress left them unable to work effectively. Groups are compared at one point in time and the days are employees' own answers, not employer records. Capacity is measured with a behavior-anchored survey informed by biomarker and physiological research, without collecting biometric data. In a 12-month study, survey answers tracked resting heart rate and heart rate variability, and when a person's capacity changed, their heart rate variability changed with it.
About thrive at work
thrive at work is a workforce performance platform that measures employee capacity alongside engagement. Its research focuses on four dimensions of capacity: energy, recovery, focus and resilience, and how they relate to sustainable performance at work. Organizations use thrive at work to measure workforce capacity and engagement, identify performance constraints and translate insights into action plans and personalized learning.
Jerry Fišer
thrive at work
jerry@thriveatwork.ai
Visit us on social media:
LinkedIn
Instagram
Facebook
YouTube
X
Legal Disclaimer:
EIN Presswire provides this news content "as is" without warranty of any kind. We do not accept any responsibility or liability for the accuracy, content, images, videos, licenses, completeness, legality, or reliability of the information contained in this article. If you have any complaints or copyright issues related to this article, kindly contact the author above.
